
提供了很丰富的图表处理功能,但它默认是保存在内存中的。如果要将图片保存到硬盘中。则需要使用到ImageLocation属性!
Chart.ImageLocation
名称空间:System.Web.UI.DataVisualization.Charting
程 序 集:System.Web.DataVisualization(system.web.datavisualization.dll)
在VS2008中,其默认值为:ChartPic_#SEQ(300,3)
看几个关联属性:
1、Chart.RenderType
此属性决定MSChart生成的图形以何种方式送到客户端,有三种:
ImageTag:图形在服务端保存为临时文件,并将临时文件的URL作为HTML中<IMG>标签的SRC属性值。而此临时文件的URL规则及临时文件如何生成可由ImageLocation属性确定。
BinaryStreaming:不在服务端生成图形文件,<IMG>标签的SRC属性值将指向另一个负责生成图形的.aspx页面。
ImageMap:不显示实际的图形,仅创建图片热区(image map)。
默认值是ImageTag,就是会在服务端生成临时文件。
2、Chart.ImageStorageMode
此属性决定生成图形的存储方式,有两个选项:
UseHttpHandler:默认值,由HTTP处理程序存储图形文件到内存或文件。但生成的文件客户端是不能够直接能过URL访问到的,<IMG>标签的SRC属性值形如:
ChartImg.axd?i=chart_67fdbfec448349e686916b97f1351e90_0.png&g=f96eecccd0334d70b8c9b0702894182b
并不指向服务端一个物理存储位置。
UseImageLocation:作为临时文件存储在服务端指定位置。在客户端可以通过URL直接获取到图片。可进一步指定图片存储目录位置。图片文件名可以是随机性的也可以是固定的。
3、Chart.ImageType
生成图形文件的格式,可以是BMG、JPEG、PNG、EMF。
现在回到Chart.ImageLocation,其实在上面已经提到了它的作用,就是决定图形临时文件的URL规则及临时文件如何生成。
(1)、这个属性只有在Chart.ImageStorageMode=UseImageLocation才有效。
(2)、
当Chart.RenderType=ImageTag时,图形文件生成后会在服务端保存。文件格式和扩展名由Chart.ImageType指定。而文
件名则可以是静态不变或动态变化的。静态就是使用一个固定名称,动态则使用一个随机名称,可以通过“#”标记来选择使用GUID或指定数字序列来确定一个
唯一的文件命名。
(3)、默认值ChartPic_#SEQ(300,3)的含义是
(4)、ImageLocation命名举例,假设Chart.ImageType=Png
属性值 生成图形文件URL
----------------------------------------------------------------
ChartPic_#SEQ(300,3) ChartPic_000003.png?d155074d-2120-49db-a95c-6a4a61911315
ChartPic ChartPic.png?27194803-a8a9-4c3e-81a7-5534a279dbe0
ChartPic#NOGUIDPARAM ChartPic.png
(5)、默认值ChartPic_#SEQ(300,3)说明
ChartPic_是前缀,#SEQ是数字序列,300表示最多允许保存300个文件,3代表3秒种,表示向事件日志中写入警告信息的时间限制。
解决方案:web.config关联配置项
只有当Chart.ImageStorageMode=UseHttpHandler时,web.config中的配置才会生效。即指定由HTTP处理程序来存储图形文件时,web.config中的配置才会生效。
例如:
显然,其中~/TempImageFiles/就是HTTP处理程序来存储图形文件的目录。
deleteAfterServicing:在图片被浏览器成功下功下载后,确定服务器上图片是否删除,默认值为false。
但请注意,如果不指定deleteAfterServicing,图片是不会被存储为文件的,应当只是暂存在内存中。
webDevServerUseConfigSettings:当在VS开发服务器中,即运行在完全信任级别(full trust level)环境时,决定生成的图片是否被保存在内存中。
注:文件夹的权限
只要在服务端生成图形文件,无论存储在哪个目录下,ASP.NET帐户都需要拥有该目录的写入权限。
参考:
1、MSChart(.NET 3.5)官方文档。
2、MSDN论坛:http://social.msdn.microsoft.com/Forums/en-US/MSWinWebChart/thread/09815478-c828-4dad-b57e-39522cea9e15
PS:不少网友遇到横坐标值不能完全显示的问题,只需要修改横坐标的间隔值即可。如:
chart_ser.ChartAreas[0].AxisX.Interval = 1;
chart_ser.ChartAreas[0].AxisX.IntervalOffset = 1;
 http://blog.csdn.net/jetable/archive/2009/01/07/3727752.aspx
介绍过基础的MSchart知识后,大家应该容易上手写代码了,最起码搞几个饼图柱状图什么的不在话下了。下面我们看看如何在实际项目中写代码。
 1:

string strSQL;
 2:

DataSet ds = new DataSet();
 3:

Chart1.ChartAreas[0].Name = "chartArea1";
 4:

Chart1.Titles.Add("chartArea1");
 5:

Chart1.Titles[0].Font = new Font("????", 14, FontStyle.Bold);
 6:

strSQL = "select col1,col2 from Report";
 7:

ds.Tables.Add(DBSQL.Query(strSQL, 300).Tables[0].Copy());
 8:

ds.Tables[0].TableName = "chartArea1";
 9:

if(ds.Tables[0].Rows.Count > 0)
10:

{
11:

    Chart1.Series[0].Name = "chartArea1";
12:

    Series ser_qqgzjz = Chart1.Series[0];
13:

    ser_qqgzjz.ChartArea = "chartArea1";
14:

     ser_qqgzjz.Points.DataBind(ds.Tables["qqgzjz"].Rows, "col2", "col1", "");
15:

    ser_qqgzjz.IsValueShownAsLabel = true;
16:

    Chart1.ChartAreas["chartArea1"].AxisY.Title = "Person";
17:

    Chart1.ChartAreas["chartArea1"].AxisX.MinorGrid.LineWidth = 0;
18:

    Chart1.ChartAreas["chartArea1"].AxisX.LabelStyle.Angle = -45;
19:

    Chart1.ChartAreas["chartArea1"].AxisX.MajorGrid.LineDashStyle = ChartDashStyle.NotSet;
20:

    Chart1.ChartAreas["chartArea1"].AxisY.MajorGrid.LineDashStyle = ChartDashStyle.Dash;
21:

}
 1:

// chart is your mschart control,srcSeriesName is the name of source series name,destSeriesName
 2:

// is the name of series you want to add,which is percent series,totalCount is the number
 3:

// which to caculator the percent
 4:

protected void TowGrid(Chart chart, string srcSeriesName, string destSeriesName, double totalCount)
 5:

{
 6:

    string strChartArea = chart.Series[srcSeriesName].ChartArea;
 7:

    chart.Series[srcSeriesName].ChartType = SeriesChartType.Column;
 8:

    double total = totalCount;
 9:

    Series destSeries = new Series(destSeriesName);
10:

    chart.Series.Add(destSeries);
11:

    destSeries.ChartType = SeriesChartType.Line;
12:

    destSeries.BorderWidth = 3;
13:

    destSeries.ChartArea = chart.Series[srcSeriesName].ChartArea;
14:

    destSeries.YAxisType = AxisType.Secondary;
15:

    chart.ChartAreas[strChartArea].AxisY2.Maximum = 100;
16:

    chart.ChartAreas[strChartArea].AxisY2.Title = "??????%??";
17:

    chart.ChartAreas[strChartArea].AxisY2.TitleFont = new Font("??????", 10);
18:

    destSeries.LabelFormat = "P1";
19:

    chart.ChartAreas[strChartArea].AxisY2.MajorGrid.LineDashStyle = ChartDashStyle.NotSet;
20:

    chart.ChartAreas[strChartArea].AxisX.LabelStyle.IsEndLabelVisible = false;
21:

    double percentage = 0.0;
22:

    foreach (DataPoint pt in chart.Series[srcSeriesName].Points)
23:

    {
24:

      percentage = (pt.YValues[0] * 100.0 / total);
25:

      destSeries.Points.Add(Math.Round(percentage, 2));
26:

    }
27:

    chart.Series[destSeriesName].IsValueShownAsLabel = true;
28:

    chart.Series[destSeriesName].MarkerColor = Color.Red;
29:

    chart.Series[destSeriesName].MarkerBorderColor = Color.MidnightBlue;
30:

    chart.Series[destSeriesName].MarkerStyle = MarkerStyle.Circle;
31:

    chart.Series[destSeriesName].MarkerSize = 8;
32:

    chart.Series[destSeriesName].LabelFormat = "0.#";
33:

  }
34:

}
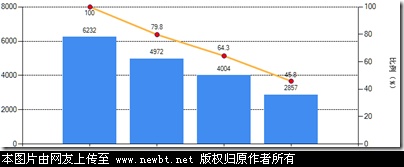
通过以上代码的结合,就能制作出如下效果的图表:
 基本上坐标操作的都是 ChartAreas 属性
1. mschart的坐标轴默认类型为decimal,所以不能太大。
2. 可以为每个点添加提示信息;
/// <summary>
/// 设置点提示信息
/// </summary>
/// <param name="sender"></param>
/// <param name="e"></param>
protected void chartCWPBestMode_PreRender(object sender, EventArgs e)
{
for (int i = 0; i < chartCWPBestMode.Series["Series1"].Points.Count; i++)
{
chartCWPBestMode.Series["Series1"].Points[i].ToolTip = i.ToString();
}
}
3.再每次加载数据时先清空曲线,防止页面刷新后曲线重叠。
chartCWPBestMode.Series["Series1"].Points.Clear();
chartCWPBestMode.Series["Series2"].Points.Clear();
chartCWPBestMode.Series["Series3"].Points.Clear();
chartCWPBestMode.Series["Series4"].Points.Clear();
4.以下是我在做的时候控制样式时用到的方法
/// <summary>
/// 设置mschart样式
/// </summary>
private void SetMSChartStyle()
{
//绘图前期处理
chartCWPBestMode.Titles.Clear();
//标题设置
Title title = new Title();
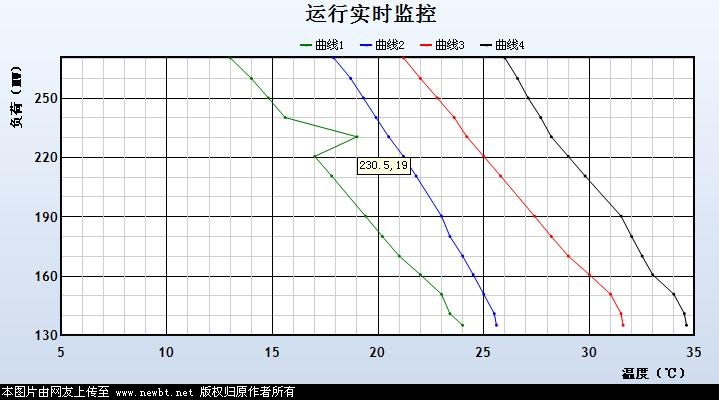
title.Text = "循环水泵最佳运行方式";
title.Font = new Font("宋体", 16f, FontStyle.Bold);
//标题
chartCWPBestMode.Titles.Add(title);
// 坐标轴设置
chartCWPBestMode.ChartAreas["ChartAreaCWP"].AxisY.IsMarginVisible = false;
//X 轴坐标最大最小值
chartCWPBestMode.ChartAreas["ChartAreaCWP"].AxisX.Minimum = 5;
chartCWPBestMode.ChartAreas["ChartAreaCWP"].AxisX.Maximum = 35;
// 坐标轴刻度线不延长出来设置
chartCWPBestMode.ChartAreas["ChartAreaCWP"].AxisX.MajorTickMark.Enabled = false;
chartCWPBestMode.ChartAreas["ChartAreaCWP"].AxisY.MajorTickMark.Enabled = false;
//X 次要辅助线设置
chartCWPBestMode.ChartAreas["ChartAreaCWP"].AxisX.MinorGrid.Enabled = true;
//X 次要辅助线间距
chartCWPBestMode.ChartAreas["ChartAreaCWP"].AxisX.MinorGrid.Interval = 1;
//X 次要辅助线颜色
chartCWPBestMode.ChartAreas["ChartAreaCWP"].AxisX.MinorGrid.LineColor = Color.LightGray;
//Y 次要辅助线设置
chartCWPBestMode.ChartAreas["ChartAreaCWP"].AxisY.MinorGrid.Enabled = true;
//Y 次要辅助线间距
chartCWPBestMode.ChartAreas["ChartAreaCWP"].AxisY.MinorGrid.Interval = 10;
//Y 次要辅助线颜色
chartCWPBestMode.ChartAreas["ChartAreaCWP"].AxisY.MinorGrid.LineColor = Color.LightGray;
//X 主要辅助线设置
chartCWPBestMode.ChartAreas["ChartAreaCWP"].AxisX.MajorGrid.Enabled = true;
//X 主要辅助线间距
chartCWPBestMode.ChartAreas["ChartAreaCWP"].AxisX.MajorGrid.Interval = 5;
//X 主要辅助线颜色
chartCWPBestMode.ChartAreas["ChartAreaCWP"].AxisX.MajorGrid.LineColor = Color.Black;
//Y 主要辅助线设置
chartCWPBestMode.ChartAreas["ChartAreaCWP"].AxisY.MajorGrid.Enabled = true;
//Y 主要辅助线间距
chartCWPBestMode.ChartAreas["ChartAreaCWP"].AxisY.MajorGrid.Interval = 30;
//Y 主要辅助线颜色
chartCWPBestMode.ChartAreas["ChartAreaCWP"].AxisY.MajorGrid.LineColor = Color.Black;
//坐标主要辅助线刻度间距
chartCWPBestMode.ChartAreas["ChartAreaCWP"].AxisX.Interval = 5;
chartCWPBestMode.ChartAreas["ChartAreaCWP"].AxisY.Interval = 30;
//坐标轴说明
chartCWPBestMode.ChartAreas["ChartAreaCWP"].AxisX.Title = "凝汽器冷却水进口温度(℃)";
chartCWPBestMode.ChartAreas["ChartAreaCWP"].AxisY.Title = "机组负荷(MW)";
chartCWPBestMode.ChartAreas["ChartAreaCWP"].AxisX.TitleFont = new Font("宋体", 10f, FontStyle.Bold);
chartCWPBestMode.ChartAreas["ChartAreaCWP"].AxisY.TitleFont = new Font("宋体", 10f, FontStyle.Bold);
chartCWPBestMode.ChartAreas["ChartAreaCWP"].AxisX.TitleAlignment = StringAlignment.Far;
chartCWPBestMode.ChartAreas["ChartAreaCWP"].AxisY.TitleAlignment = StringAlignment.Far;
//边框样式设置
chartCWPBestMode.ChartAreas["ChartAreaCWP"].BorderColor = Color.Black;
chartCWPBestMode.ChartAreas["ChartAreaCWP"].BorderDashStyle = ChartDashStyle.Solid;
chartCWPBestMode.ChartAreas["ChartAreaCWP"].BorderWidth = 2;
//图例文字
chartCWPBestMode.Series["SeriesCurrentMode"].LegendText = "当前运行方式";
chartCWPBestMode.Series["SeriesTRAN1"].LegendText = "单泵高速切换曲线";
chartCWPBestMode.Series["SeriesTRAN2"].LegendText = "两机三泵切换曲线";
chartCWPBestMode.Series["SeriesTRAN3"].LegendText = "一高一低切换曲线";
chartCWPBestMode.Series["SeriesTRAN4"].LegendText = "两泵高速切换曲线";
//图例位置、字体设置;坐标轴位置设定
chartCWPBestMode.Legends[0].Position = new ElementPosition(10, 10, 88, 7);
chartCWPBestMode.Legends[0].Font = new Font("宋体", 9);
chartCWPBestMode.ChartAreas[0].InnerPlotPosition = new ElementPosition(6, 5, 90, 82);
}
5.附MSChart属性列表
ChartAreas:增加多个绘图区域,每个绘图区域包含独立的图表组、数据源,用于多个图表类型在一个绘图区不兼容时。
AlignmentOrientation:图表区对齐方向,定义两个绘图区域间的对齐方式。
AlignmentStyle:图表区对齐类型,定义图表间用以对其的元素。
AlignWithChartArea:参照对齐的绘图区名称。
InnerPlotPosition:图表在绘图区内的位置属性。
Auto:是否自动对齐。
Height:图表在绘图区内的高度(百分比,取值在0-100)
Width:图表在绘图区内的宽度(百分比,取值在0-100)
X,Y:图表在绘图区内左上角坐标
Position:绘图区位置属性,同InnerPlotPosition。
Name:绘图区名称。
Axis:坐标轴集合
Title:坐标轴标题
TitleAlignment:坐标轴标题对齐方式
Interval:轴刻度间隔大小
IntervalOffset:轴刻度偏移量大小
MinorGrid:次要辅助线
MinorTickMark:次要刻度线
MajorGrid:主要辅助线
MajorTickMark:主要刻度线
DataSourceID:MSChart的数据源。
Legends:图例说明。
Palette:图表外观定义。
Series:最重要的属性,图表集合,就是最终看到的饼图、柱状图、线图、点图等构成的合;可以将多种相互兼容的类型放在一个绘图区域内,形成复合图。
IsValueShownAsLabel:是否显示数据点标签,如果为true,在图表中显示每一个数据值
Label:数据点标签文本
LabelFormat:数据点标签文本格式
LabelAngle:标签字体角度
Name:图表名称
Points:数据点集合
XValueType:横坐标轴类型
YValueType:纵坐标轴类型
XValueMember:横坐标绑定的数据源(如果数据源为Table,则填写横坐标要显示的字段名称)
YValueMembers:纵坐标绑定的数据源(如果数据源为Table,则填写纵坐标要显示的字段名称,纵坐标可以有两个)
ChartArea:图表所属的绘图区域名称
ChartType:图表类型(柱形、饼形、线形、点形等)
Legend:图表使用的图例名称
Titles:标题集合。
width:MSChart的宽度。
height:MSChart的高度。
注意:清空MSchart方法.
如果在同一个页面中显示不同的曲线。在曲线切换时会出现MSchart设置不能正确初始化。
方法是:在HTML中不能写死<ChartAreas>等,必须在程序中动态添加。
如:mschart.Series.Add("1");
mschart.Series.Add("2");
mschart.ChartAreas.Add("11");
使用前必须
mschart.Series.Clear();